Welcome
👋 Hey I'm Lawnish
I'm a data analyst based in Gurgaon, India, with a passion for turning raw data into stunning, user-friendly dashboards. With a strong foundation in data analysis and visualization, I help businesses uncover insights and make smarter, data-driven decisions. Obsessed with clean design and clear storytelling, I'm always on the lookout for fresh challenges and opportunities to level up my skills and grow in the world of analytics.
What i'm doing
-

Data analysis
Transforming Raw Data Into Actionable Intelligence for Business Impact.
-

Dashboard Building
Building Smart Dashboards and Analytical Tools to Simplify Complex Data.
-

Data Scrapping
Extracting Valuable Insights from the Web—Clean, Accurate, and Fast.
-

Photography
I make high-quality photos of any category at a professional level.
Resume
Education
-
Satyug Darshan Institute of Engineering and Technology
2021 — PresentCurrently pursuing B.Tech in Computer Science and Engineering.
Projects
-
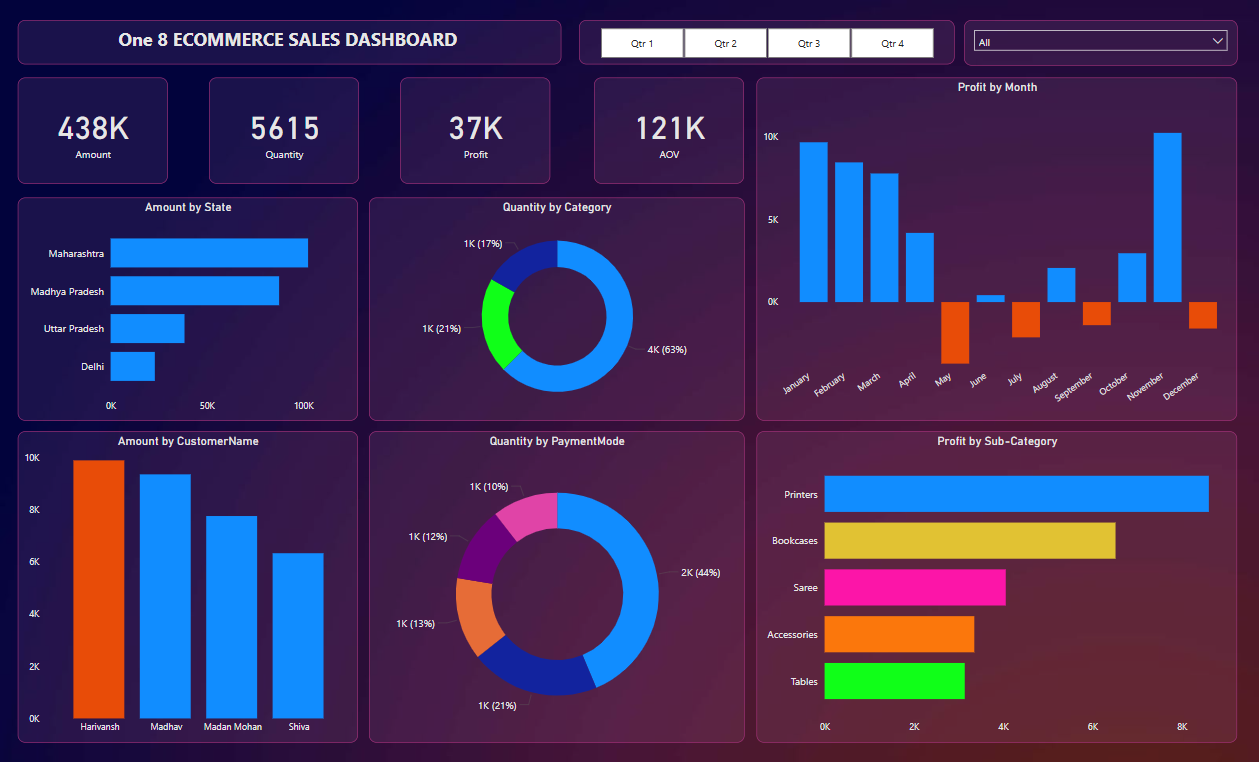
Laptop Price Predictor
Python and SQL• Developed a machine learning model to predict laptop prices using Python and SQL, achieving 85% accuracy in price predictions.
• Collected and preprocessed dataset of 1000+ laptops, handling missing values and performing feature engineering.
• Automated data collection process using SQL and Python scripts, reducing manual effort by 70%.
-
QnAi
Python, Streamlit, OpenAI• Developed a Python-based QnAi Chat App to enable conversational querying across multiple PDF documents using natural language processing techniques.
• Integrated PDF parsing and embedding models with vector databases to support context-aware, multi-document Q&A functionality.
• Implemented a user-friendly interface for seamless document uploads and real-time AI responses, enhancing user experience and accessibility.
-
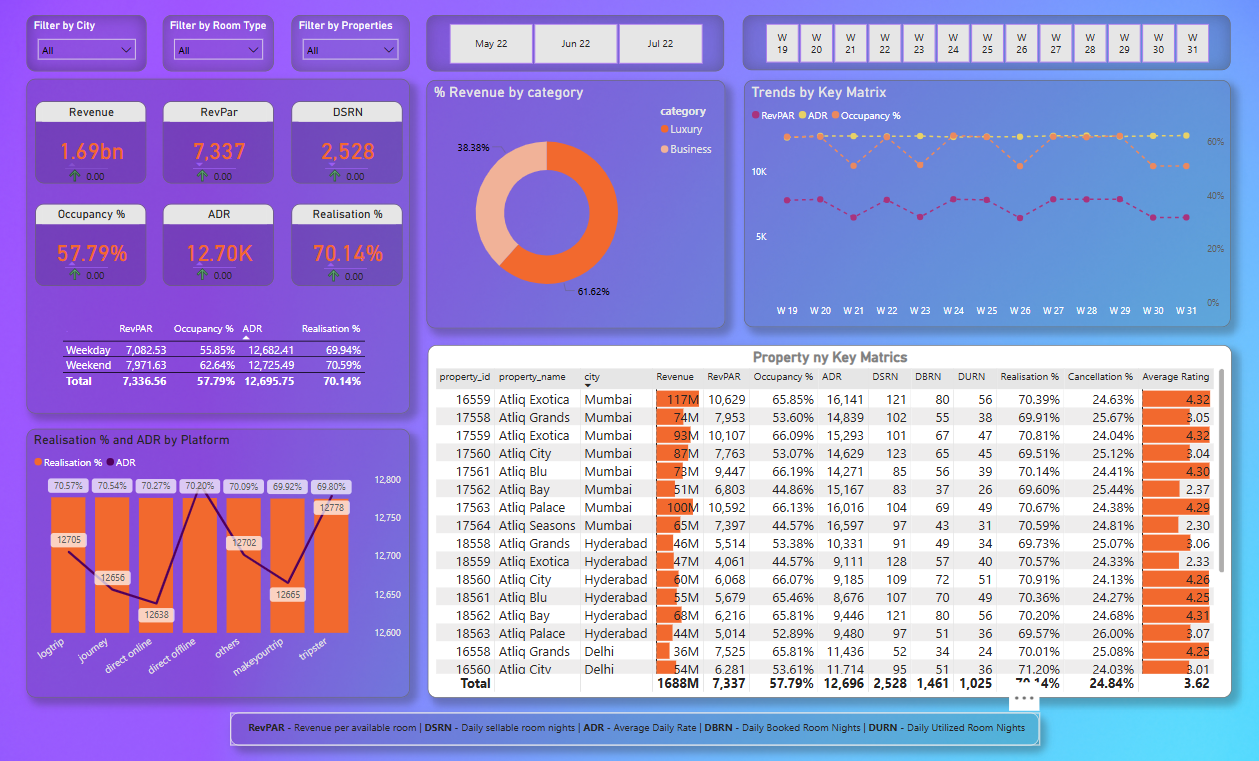
Hospitality Domain
Power BI• Created an interactive Power BI dashboard for the hospitality domain to visualize key performance indicators (KPIs).
• Utilized DAX formulas to perform advanced calculations and derive meaningful insights from raw data.
• Enhanced reporting capabilities by implementing dynamic filters, slicers, and drill-down functionalities.
-
Marvel vs DC
Microsoft Excel and Power BI• Designed and developed an interactive Marvel vs DC analytics dashboard comparing revenue, ratings, and movie counts across timelines using data visualization tools.
• Utilized Microsoft Excel for data cleaning, transformation, and analysis, ensuring data accuracy and integrity.
• Created dynamic visualizations for total revenue generation, highest-grossing movies, and top IMDb-rated movies.
My skills
-
Python
80% -
Power BI
90% -
SQL
85% -
Microsoft Excel
85%
Projects
Certifications
-
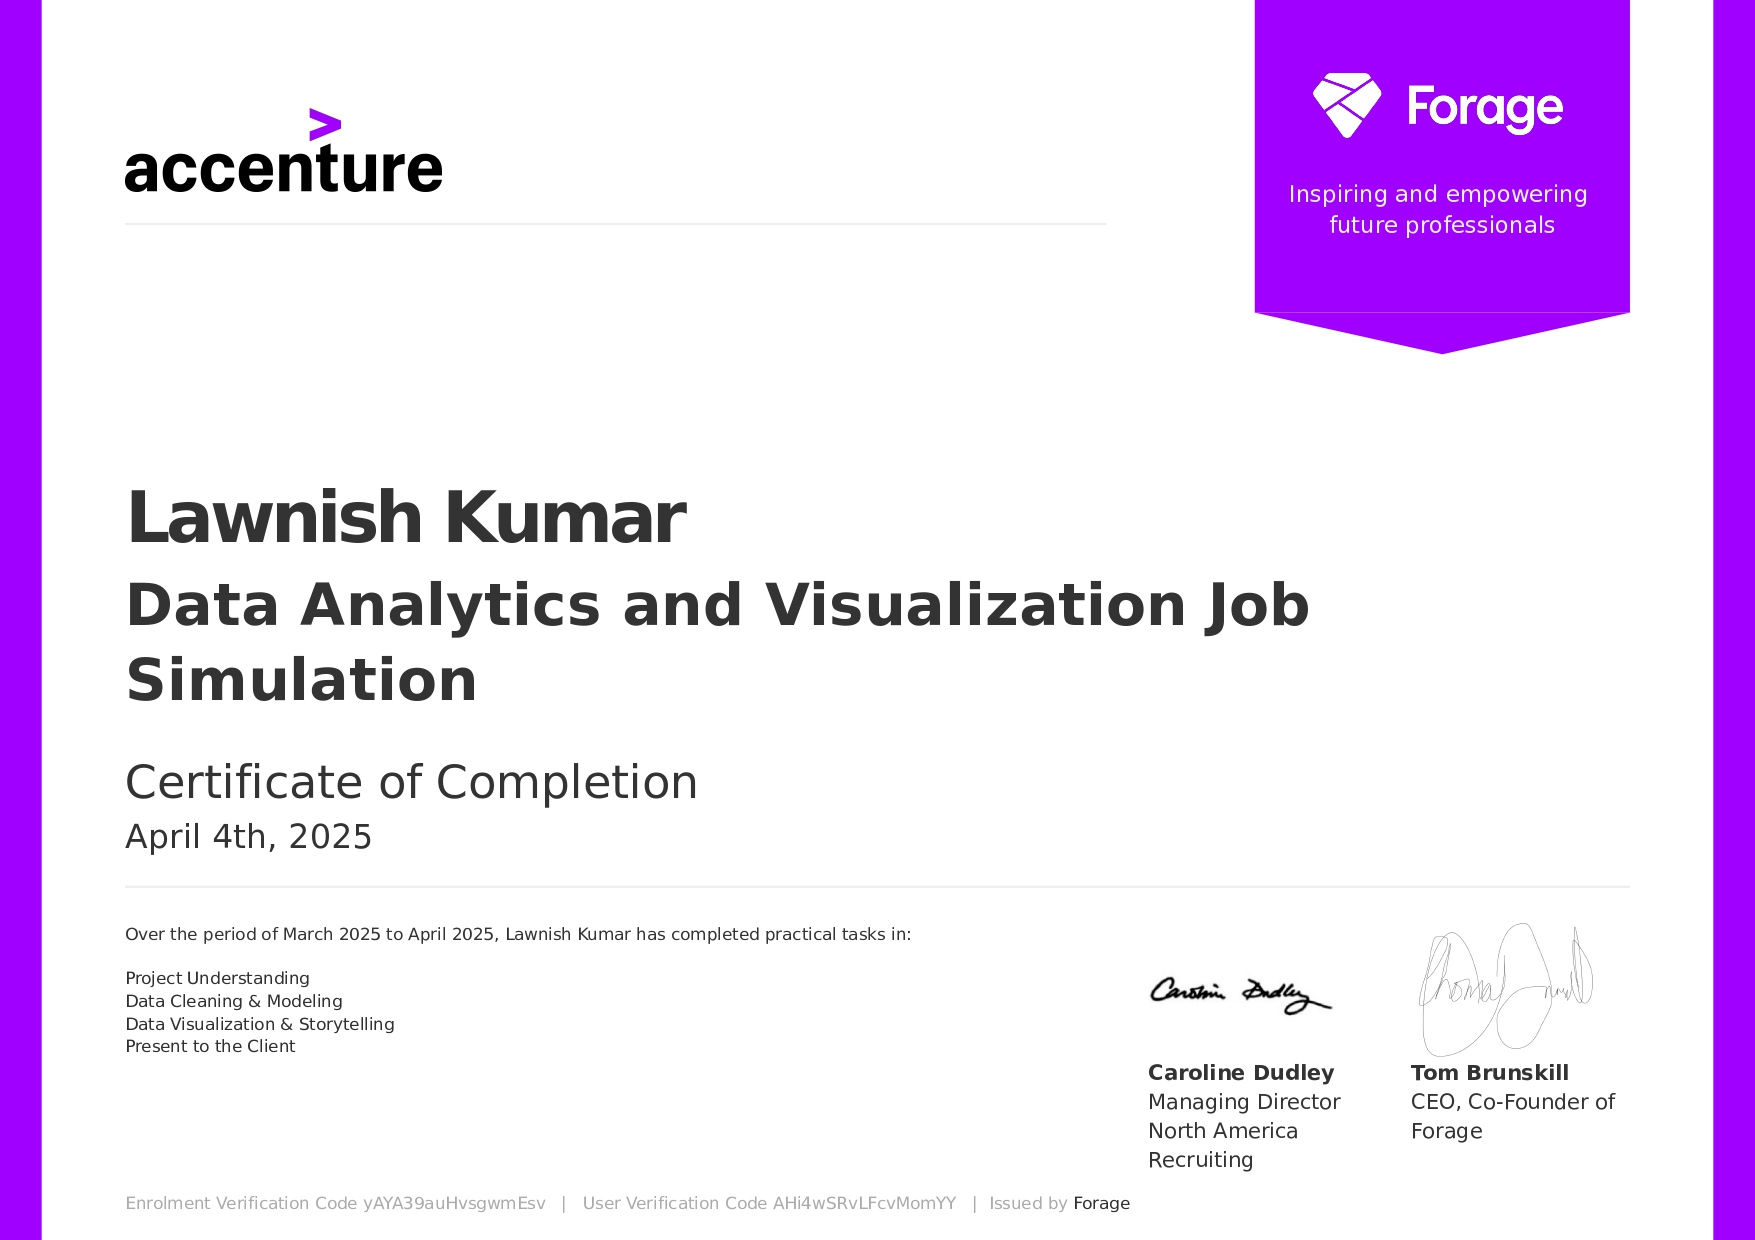
Accenture - Data Visualization and Job Simulation
-
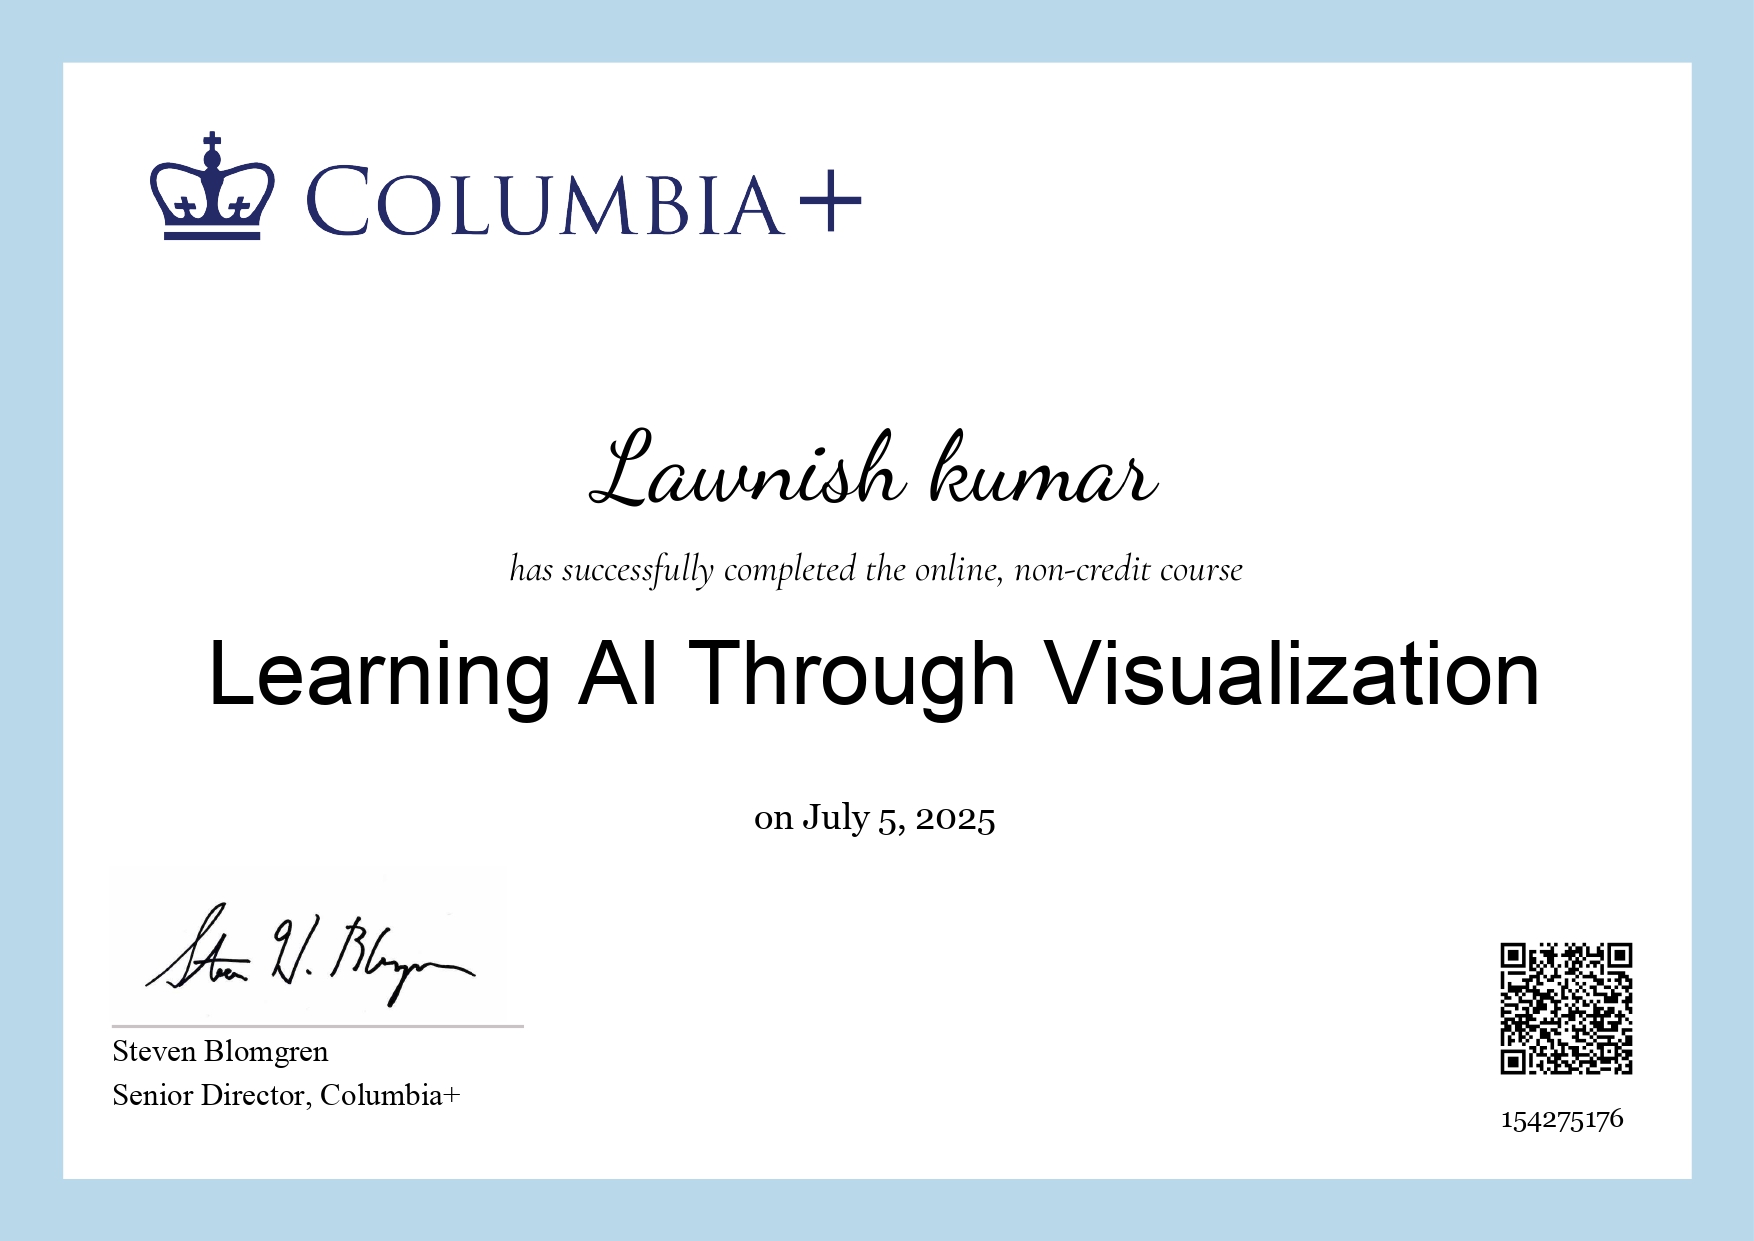
Learning AI Through Visualisation
-
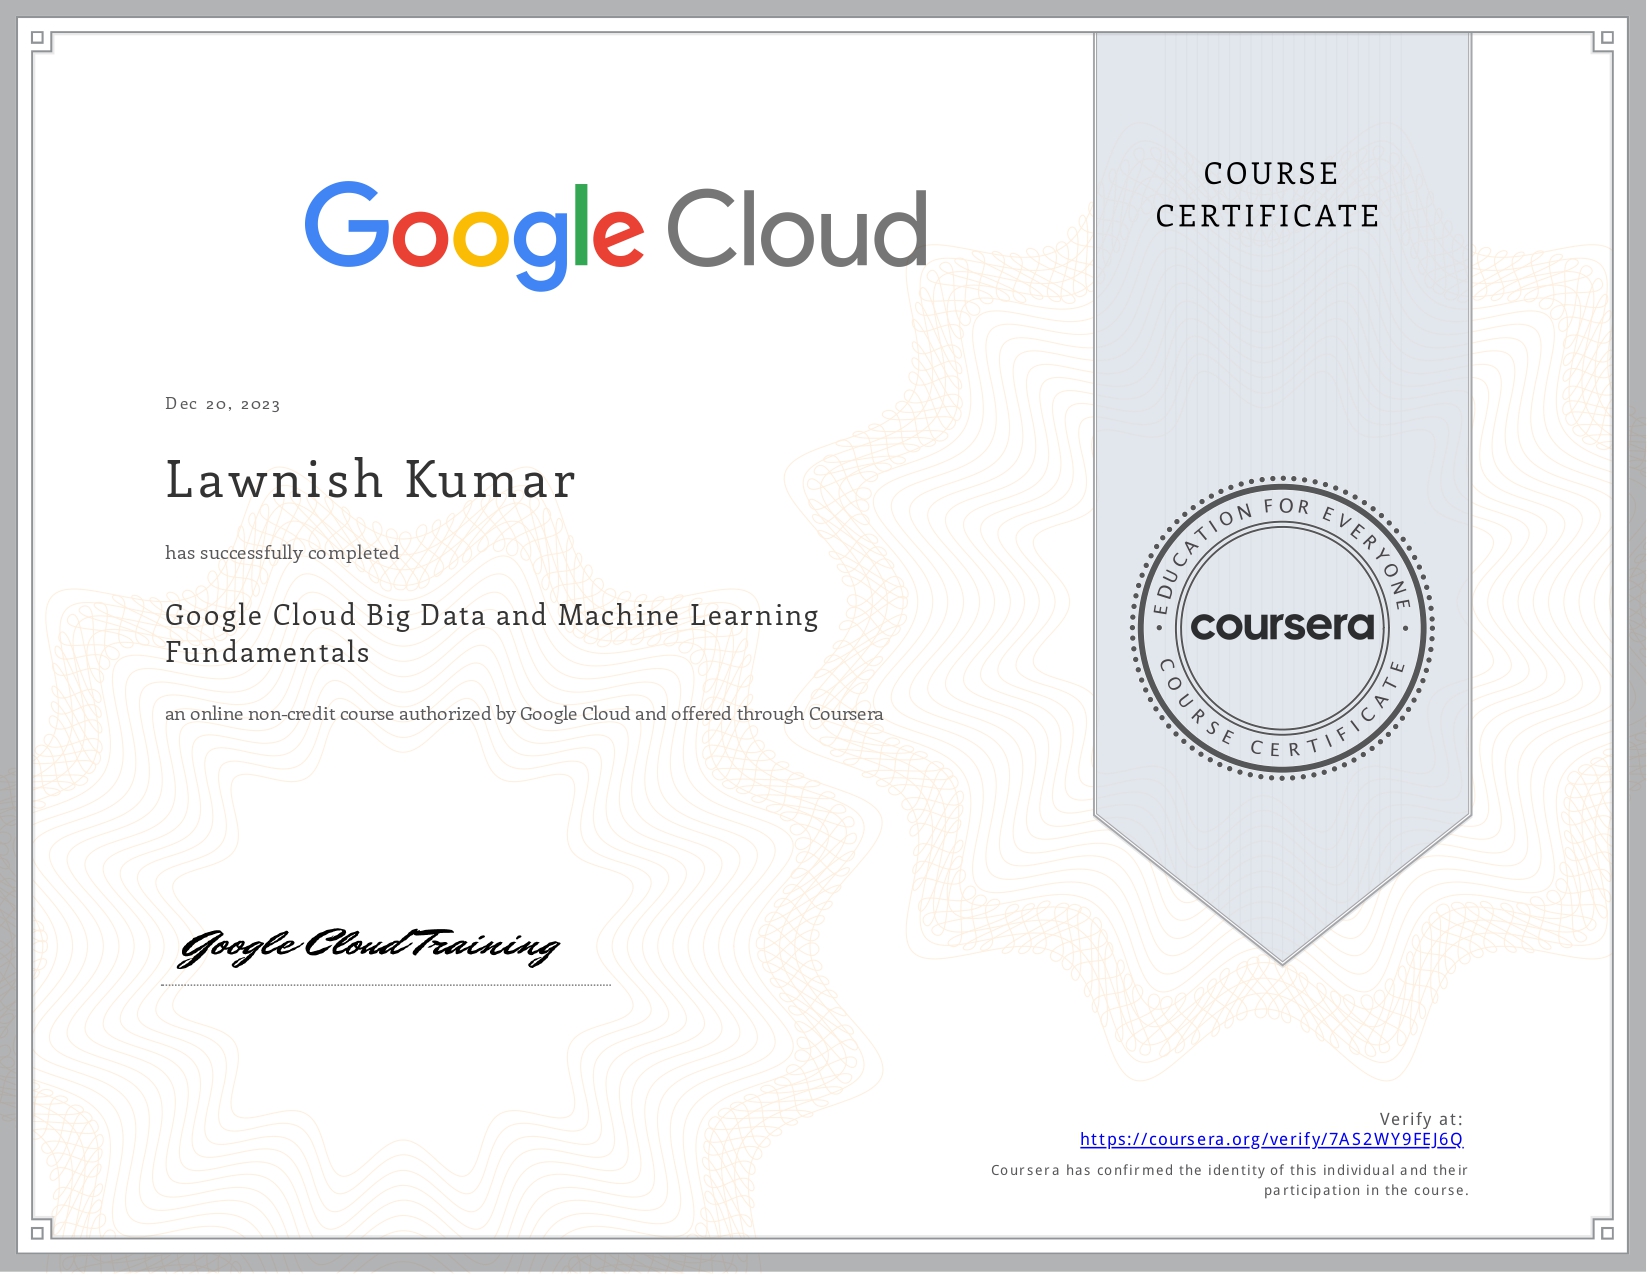
Google Cloud Certification: Big Data and Machine Learning fundamentals
-
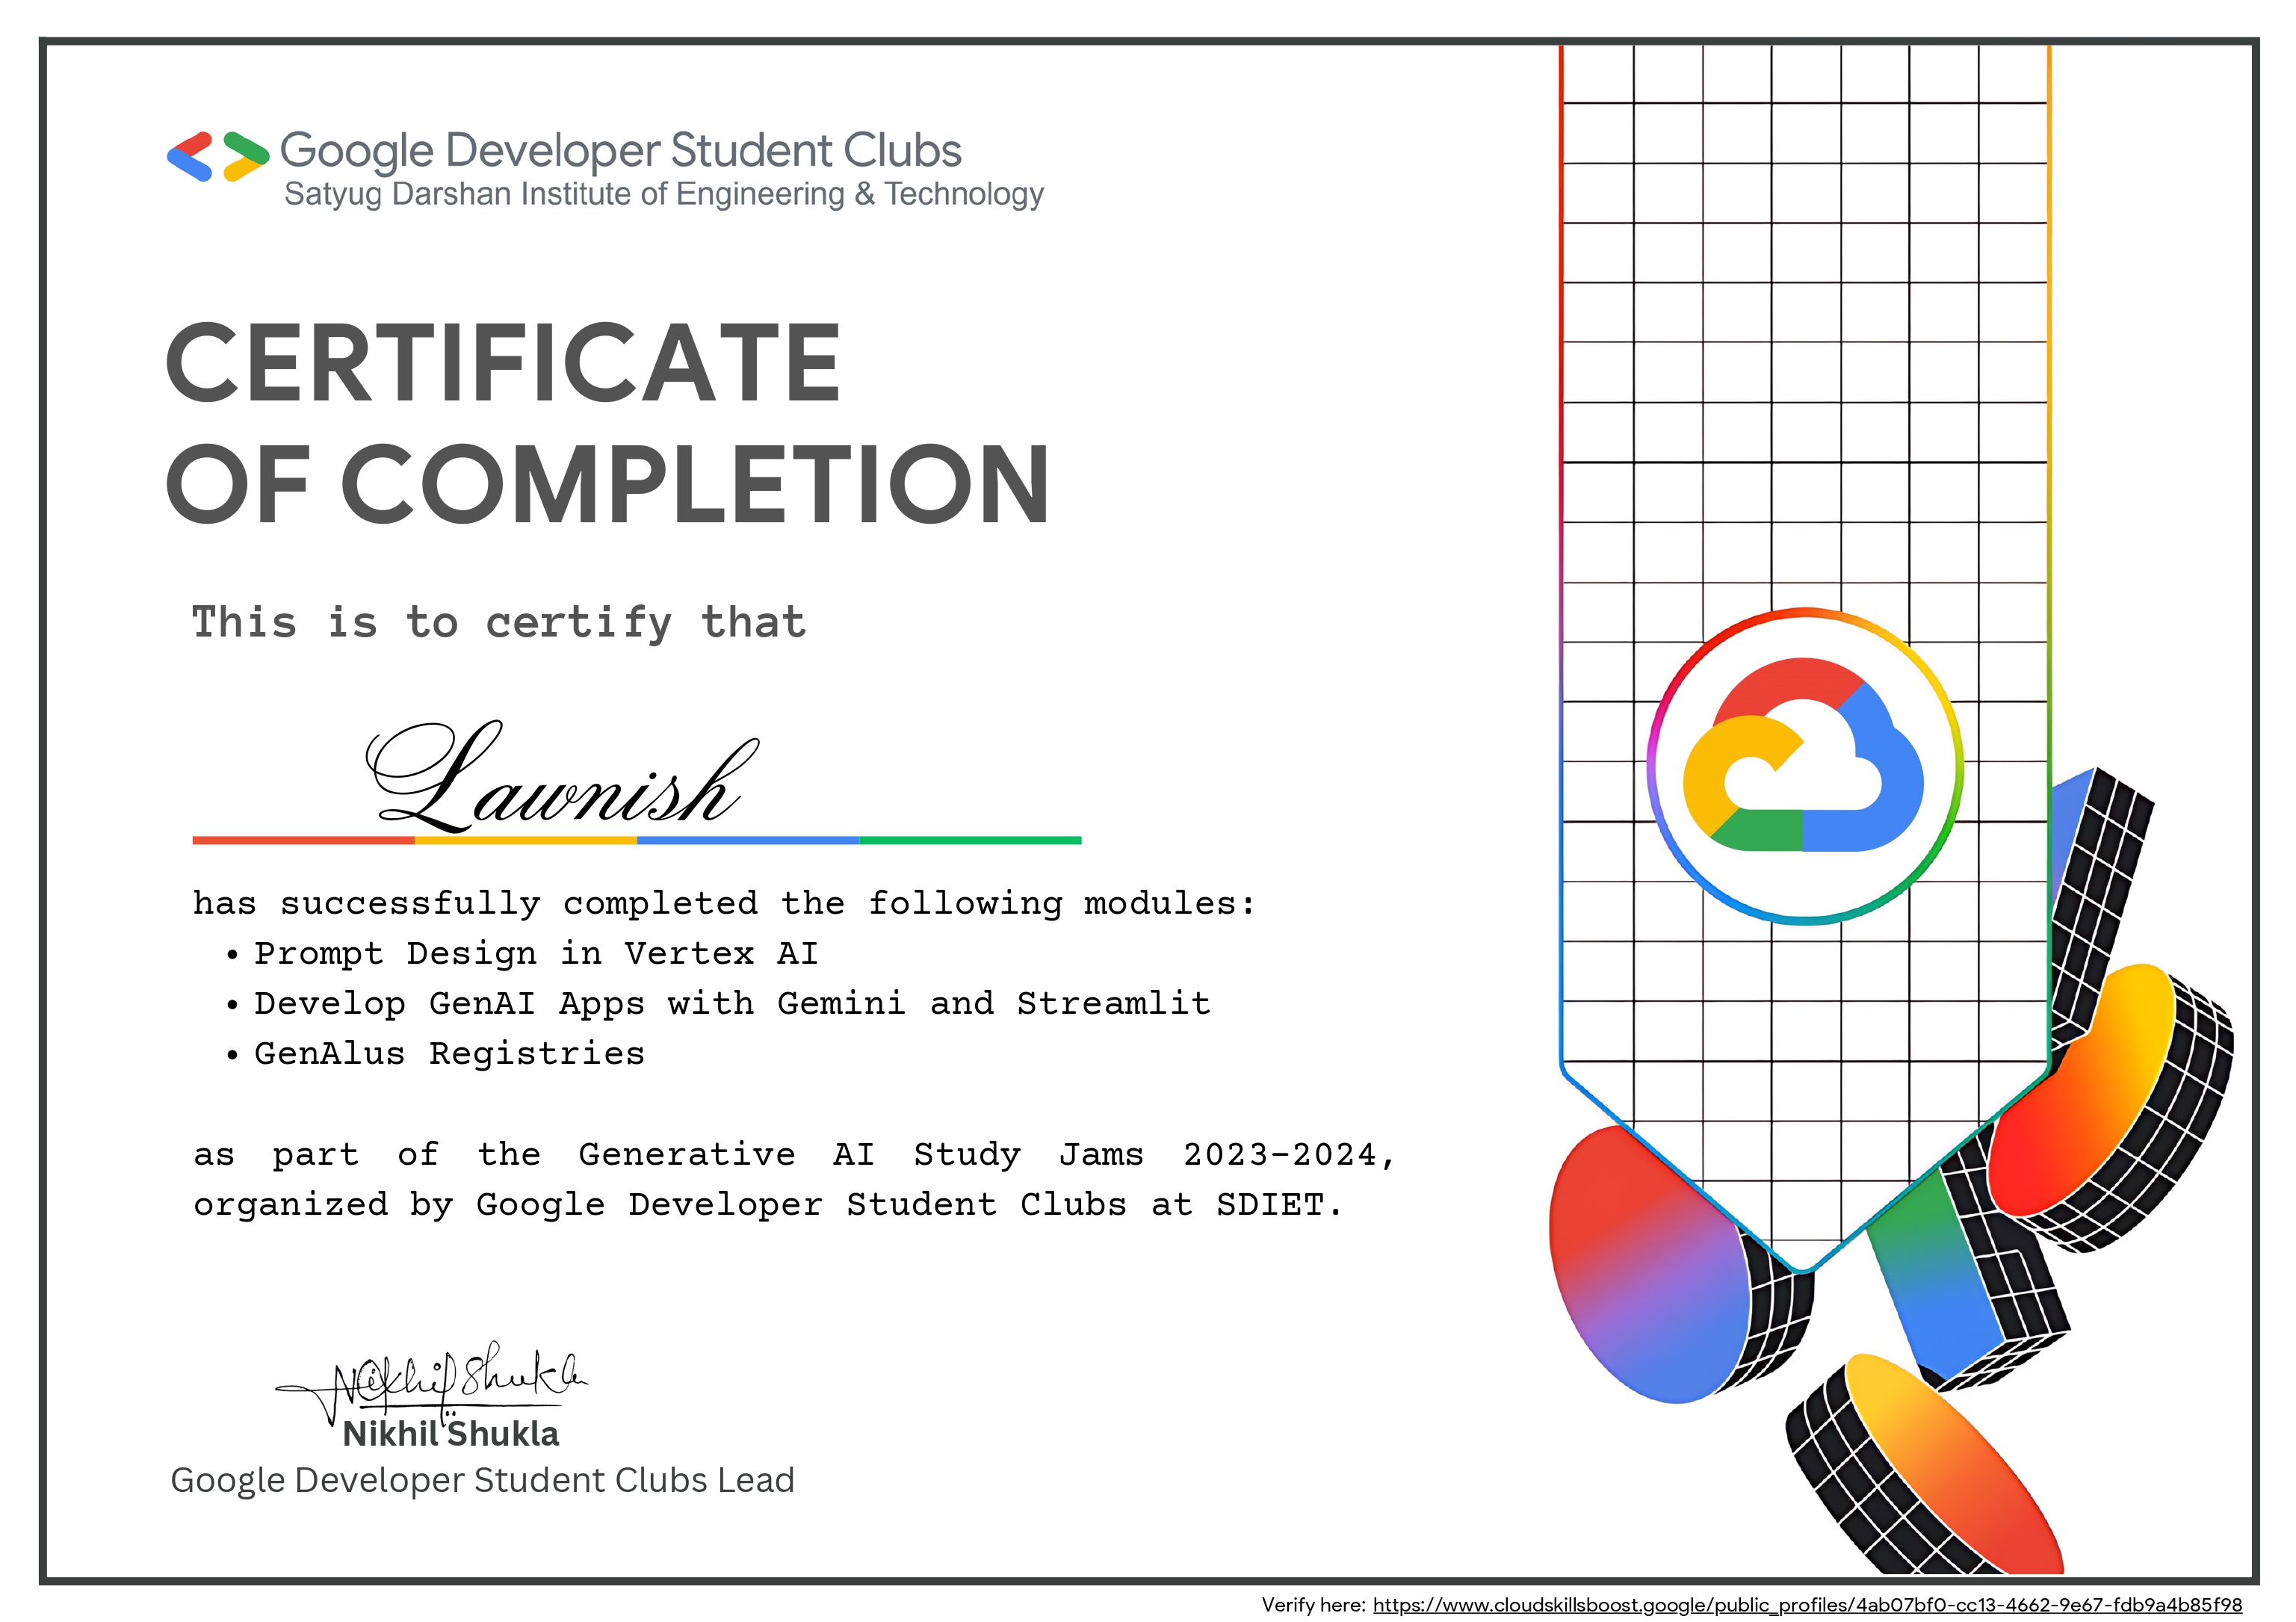
Prompt Design Vertex AI & Develop GenAI Apps
-

Google Cloud Certification: Data Lake and Data Warehouses
-

Generative AI & Google Cloud Computing fundamentals
-
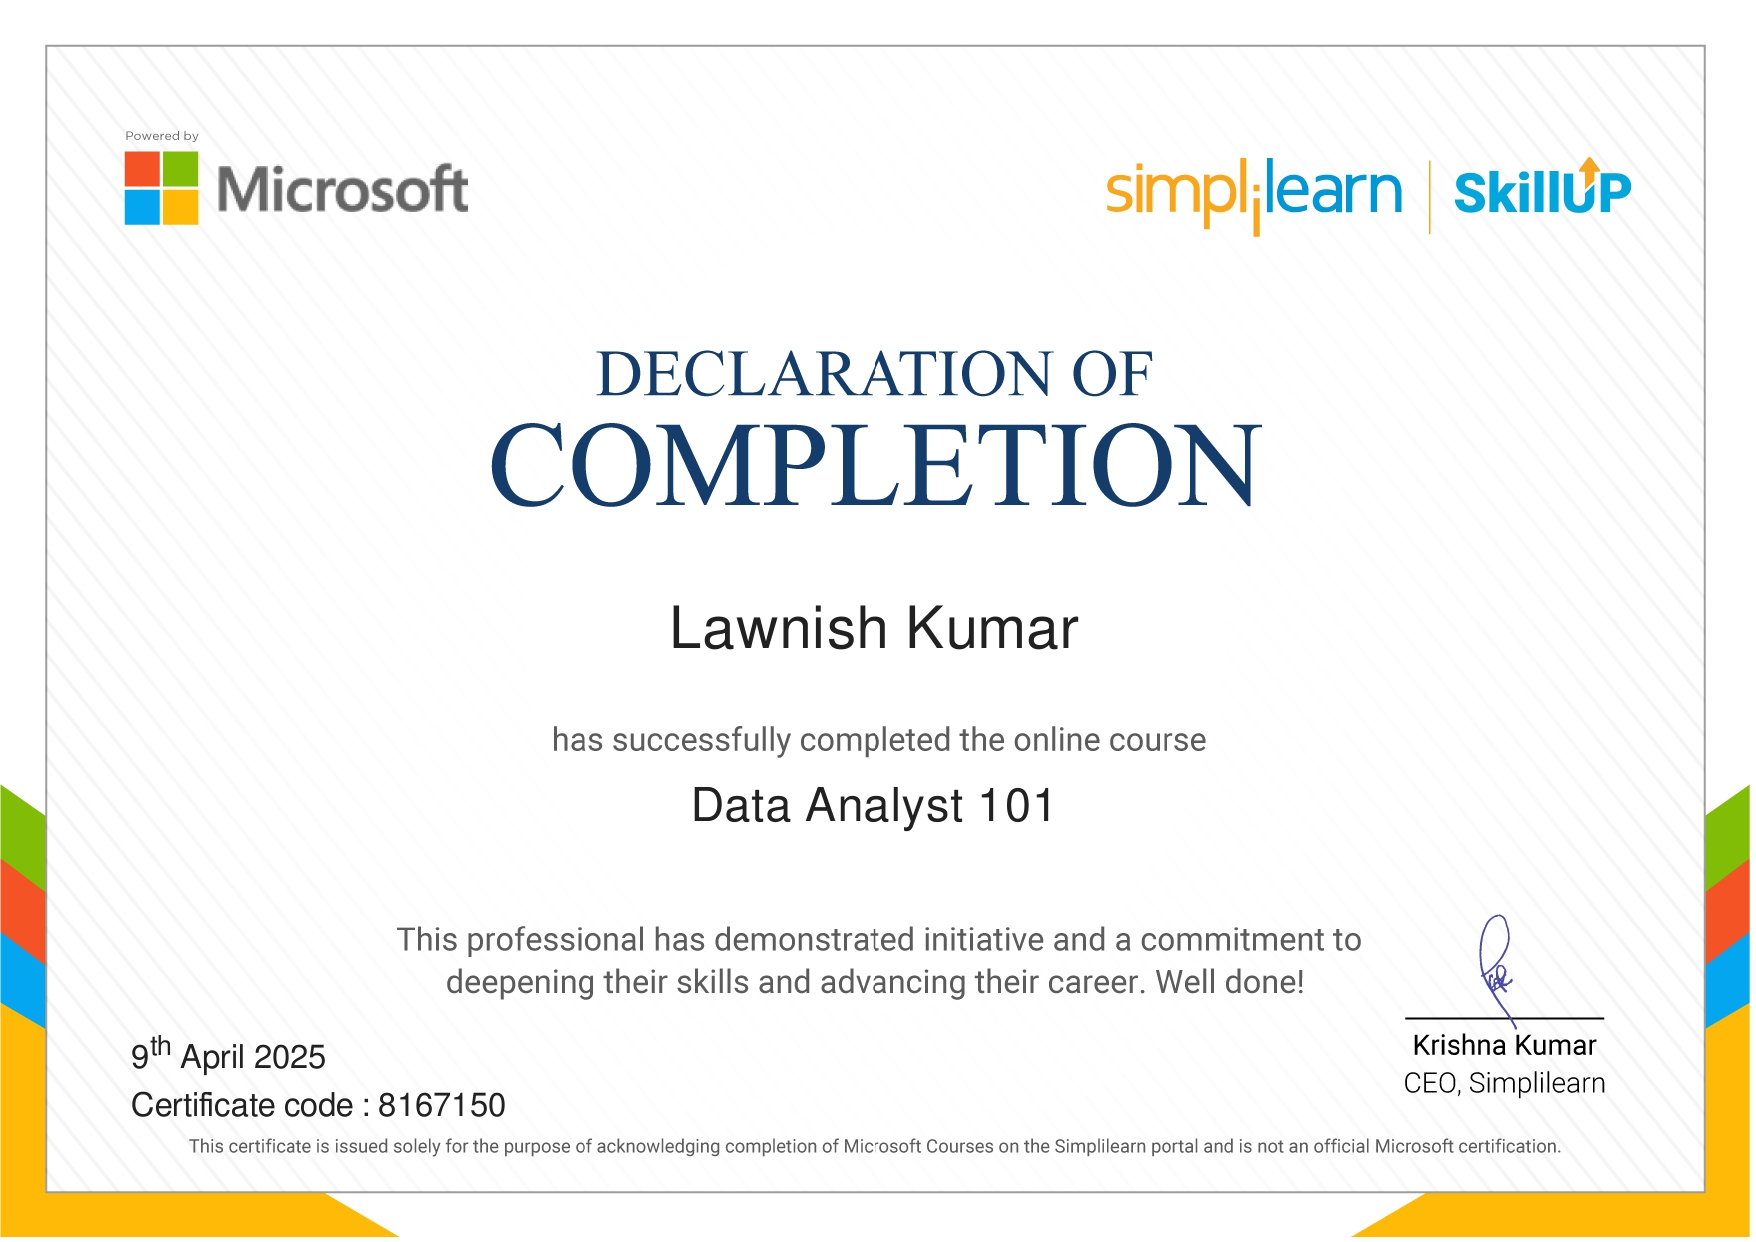
Microsoft Certification - Data Analyst 101
-
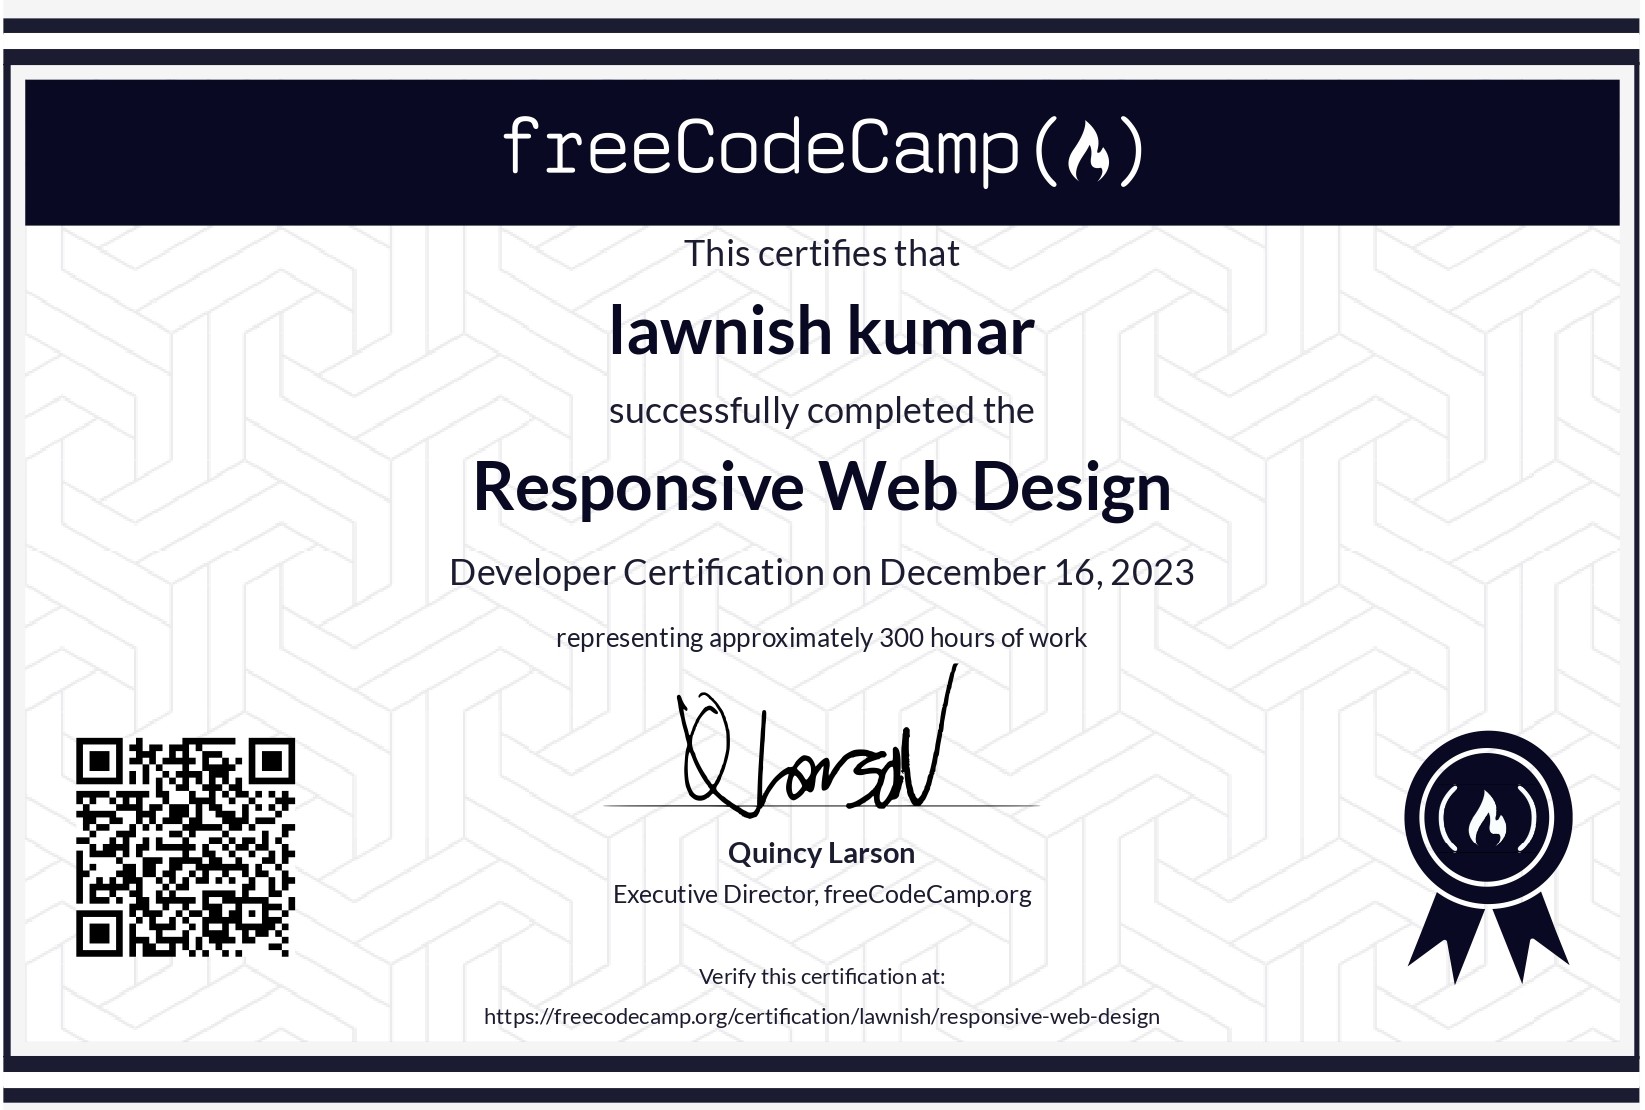
Responsive Web Design Certification
-
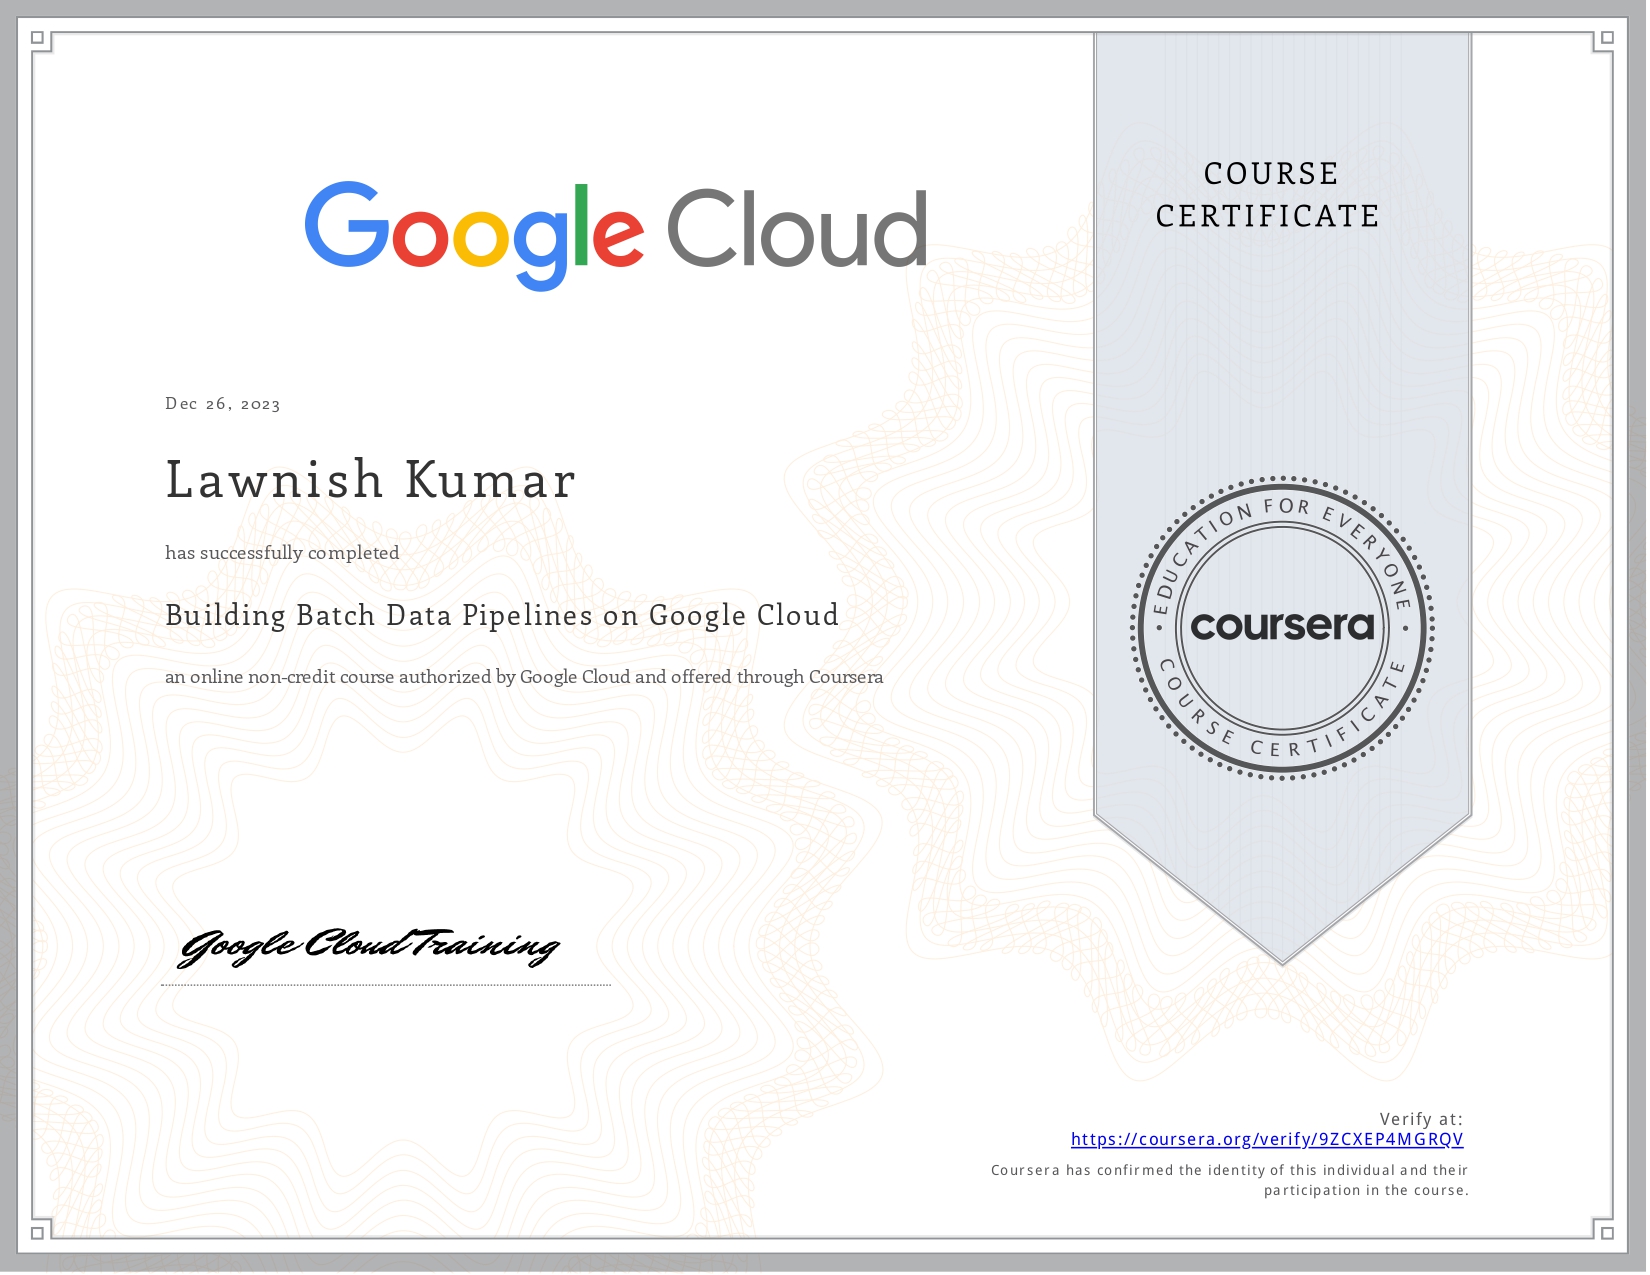
Google Cloud Certification: Building Batch Data Pipeline
-
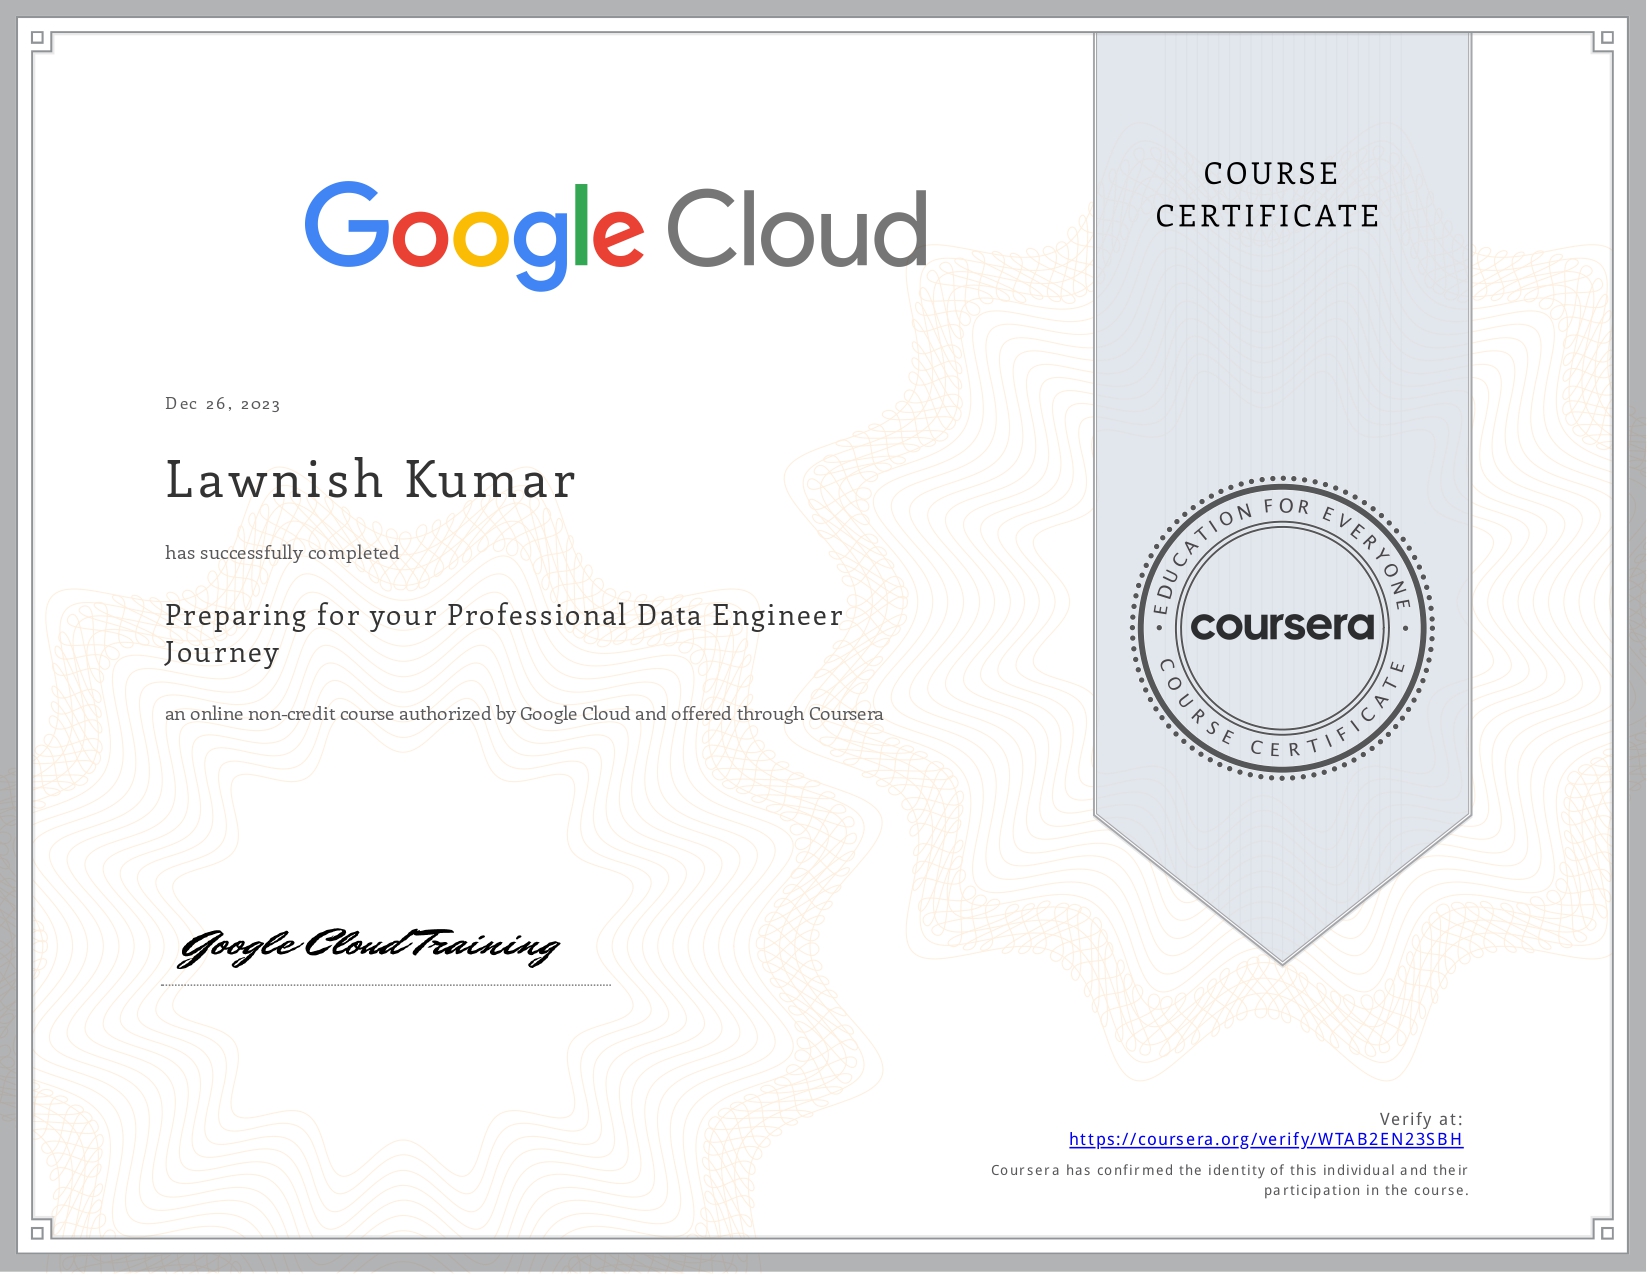
Google Cloud Certification: Data Engineer